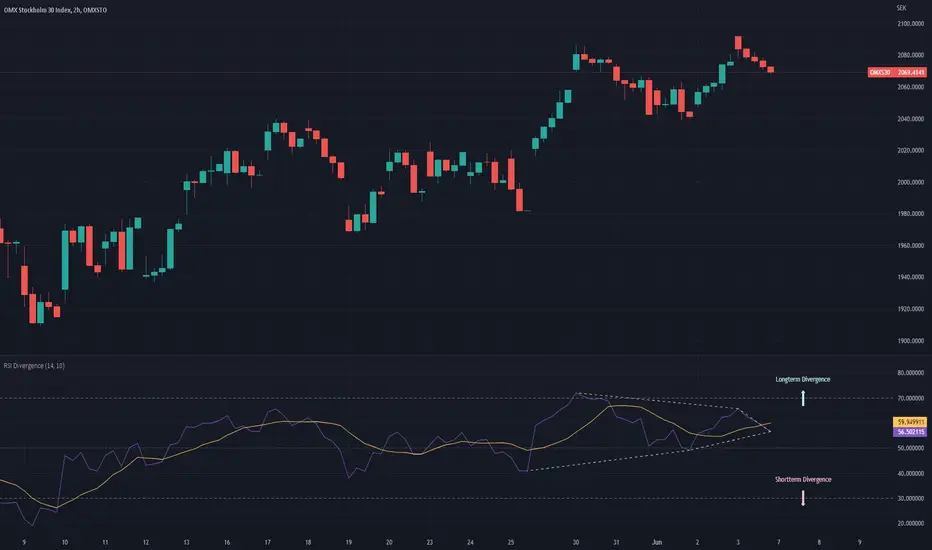
RSI Divergence Screener (MTF)
This powerful screener identifies RSI divergences across multiple symbols and timeframes, presenting the results in a clean, easy-to-read table. It screens for both regular bullish and bearish divergences, allowing you to quickly spot potential trend reversals.
The screener tracks the status of each divergence, categorizing it as:
Active (A): A divergence has formed and is still developing.
Complete (✔): The divergence has been confirmed (optionally, by the RSI crossing the 50 midpoint).
Expired (X): The divergence has persisted for too long without confirmation.
Invalidated (✖): A new high or low has been made, nullifying the divergence.
With customizable settings for RSI length, divergence sensitivity, and the ability to select up to six symbols and three timeframes, this tool is ideal for traders who want to monitor multiple markets efficiently.
Future Features
Expanded Divergence Types: The indicator will be enhanced to detect Hidden Bullish and Hidden Bearish divergences, which signal trend continuation. This will provide a more comprehensive view of potential trading opportunities.
Advanced Completion Flags: Users will have greater control over how a divergence is confirmed. New options will include:
RSI Level Confirmation: The ability to specify any RSI level (e.g., 30 or 70) for completion, rather than being limited to the midpoint of 50.
Breakout/Breakdown Confirmation: A divergence will be marked as complete when the price breaks out above the previous pivot high for a bullish divergence, or breaks down below the previous pivot low for a bearish divergence. This is a powerful signal that the trend has reversed.
Cerca negli script per "rsi divergence"
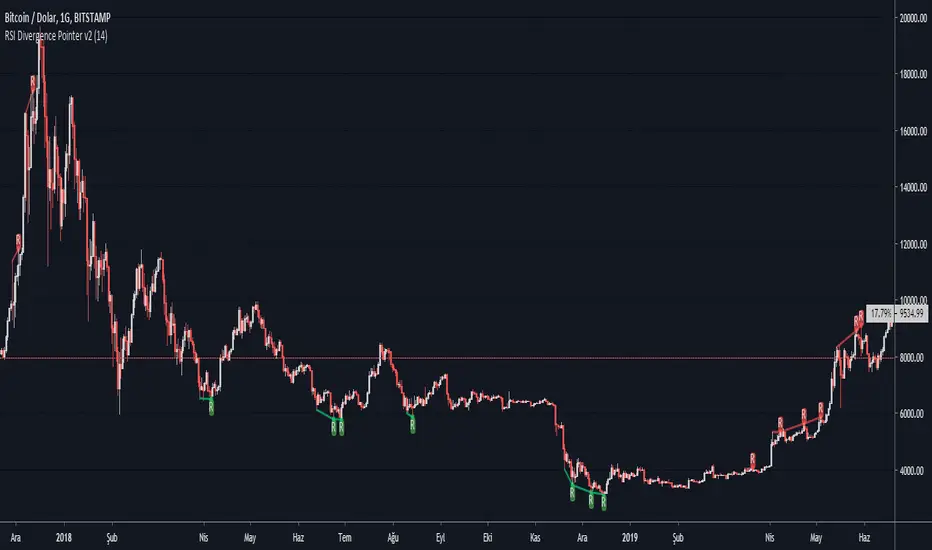
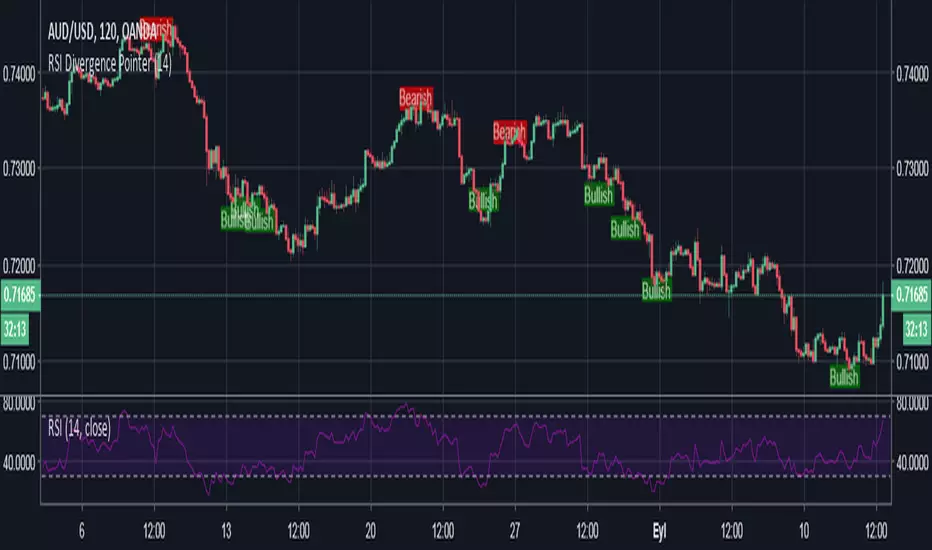
RSI Divergence Pointer v2This script points regular and optionally hidden types of bullish and bearish RSI divergences on the chart by drawing the divergence lines and optionally labels.
Hidden divergence is disabled by default, it can be enabled over settings window.
There is an option to display the price channel additionally.
Added alerts for 4 types of divergences
Titles and messages are the same:
"Regular Bearish Divergence"
"Regular Bullish Divergence"
"Hidden Bearish Divergence"
"Hidden Bullish Divergence"
RSI Divergences + Bollinger Bands█ OVERVIEW
Here's the RSI divergences with Bollingers bands.
█ CONCEPTS
5 features
1 — RSI
2 — Bollinger bands
3 — RSI signal is in another color when above 70 or below 30
4 — Looking for previous Divergences, Bullish, Bearish and Hidden Bullish and Bearish but I don't like Hidden divergences
5 — Color fill when overbuy or oversold
█ OTHER SECTIONS
I like to see it like a moutain, with snow on top and lake on bottom. I think you don't want to start walking at the top, nor sink to the bottom of the lake for ever and ever.
It is an idea of sjoerd , tip him if you like it.
An oscillator is good to know where we are in the trends, but it's not enough to run a small business of trading, you need to learn how to use it.
What is a divergence ?
Thanks to The rational investor for teaching me how to use this indicator.
RSI DivergenceWhat is RSI Divergence?
It occurs when the price action and RSI are moving in opposite directions, suggesting an early sign of reversal.
When the price action is making lower lows while RSI is making higher lows, a regular bullish divergence forms.
This indicator detects four types of divergences:
Regular bear divergence marked in R tag above the RSI line, hidden bear divergence marked in a H tag above the RSI line, regular bull divergence marked in a R tag below the RSI line, and hidden bull divergence marked in a H tag below the RSI line.

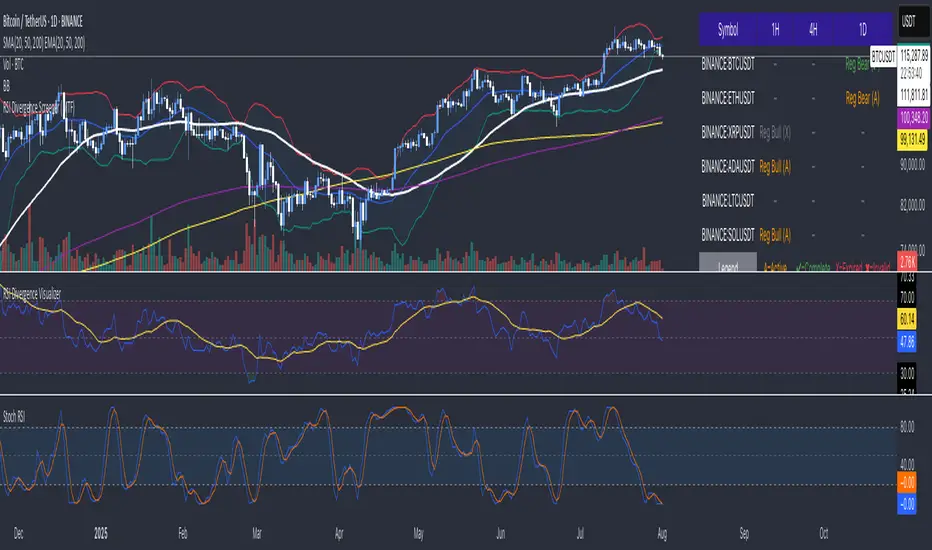
RSI Divergence Screener by zdmreThis screener tracks the following for up to 20 assets:
-All selected tickers will be screened in same timeframes (as in the chart).
-Values in table indicate that how many days passed after the last Bullish or Bearish of RSI Divergence.
For example, when BTCUSDT appears Bullish-Days Ago (15) , Bitcoin has switched to a Bullish Divergence signal 15 days ago.
Thanks to @QuantNomad and @MUQWISHI for building the base for this screener.
*Use it at your own risk
Note:
Screener shows the information about the RSI Divergence Scanner by zdmre with default settings.
Based indicator:

RSI-Divergence Goggles [Trendoscope®]🎲 Introducing the RSI-Divergence Goggle
🎯 Revolutionizing Divergence Analysis in Trading
While the concept of divergence plays a crucial role in technical analysis, existing indicators in the community library have faced limitations, particularly in simultaneously displaying divergence lines on both price and oscillator graphs. This challenge stems from the fact that RSI and other oscillators are typically plotted in a separate pane from the price chart. Traditional Pine Script® indicators are confined to a single pane, thus restricting comprehensive divergence analysis.
🎯 Our Innovative Solution: RSI on the Price Pane
The RSI-Divergence Goggle breaks through these limitations. Our innovative approach involves plotting the RSI directly onto the price pane within a movable and resizable widget. This groundbreaking feature allows for the simultaneous drawing of zigzag patterns on both price and the oscillator, enabling the effective calculation and visualization of divergence lines on both.
🎯 The Foundation: Our Divergence Research and Rules
Our journey into divergence research began three years ago with the launch of the "Zigzag Trend Divergence Detector." The foundational rules established with this script remain pertinent and form the basis of all our subsequent divergence-based indicators.
🎯 Understanding Divergence: Key Concepts
Divergence Varieties : We identify two main types - Bullish Divergence (and its hidden counterpart) occurs at pivot lows, while Bearish Divergence (and its hidden version) appears at pivot highs.
Contextual Occurrence : Bullish divergence is a phenomenon of downtrends, whereas bearish divergence is unique to uptrend. Conversely, hidden bullish divergence arises in uptrends, and hidden bearish divergence in downtrends.
Oscillator Behavior : In standard divergence scenarios, the oscillator lags behind price, signaling potential reversals. In hidden divergence cases, the oscillator leads, suggesting trend continuation.
🎯 Visual Insights: Divergence and Hidden Divergence
For a clearer understanding, refer to our visual guides:
🎯 A Word of Caution
While divergence is a powerful tool, it's not a standalone guarantee of trend reversals or continuations. We recommend using these patterns in conjunction with support and resistance levels, as demonstrated in our "Divergence Based Support Resistance" implementation.
🎯 Using the RSI-Divergence Goggles
Upon applying the indicator to your chart, you'll be prompted to select two corner points, defining the widget's placement and size. This widget is the stage for your RSI plotting and divergence calculations. Choose these points carefully to ensure they encompass your area of interest without overlapping important price bars.
An example as below.
🎯 Innovative Features:
Plotting RSI: RSI values are scaled from 0 to 100 within the widget. This unique plotting may not align with individual bar values, but pivot labels and tooltips provide detailed RSI and retracement ratio information.
Zigzag and Pivots: Our adjusted RSI plots determine the zigzag pivot highs and lows, which may not always correspond with visible price pivots. However, calculations based on close prices ensure minimal deviation.
Divergence Display: Divergence types are identified following our established rules, with a simple moving average employed to discern the prevailing trend.
🎯 Trend Detection Mechanism
A simple moving average is used as base for determining the trend. If the difference between moving averages of the alternate pivots is positive, then the sentiment is considered to be uptrend. Else, we consider the sentiment to be in downtrend.
This is a simple method to identify trend, implemented via this indicator. The indicator does not provide alternative methods to identify trend. This is something that we can explore in the future.
🎯 Interactive and Customizable
The RSI-Divergence Goggle isn't just a static tool; it's an interactive feature on your chart. You can move or resize the widget, allowing for dynamic analysis and focused study on different chart segments.

[_ParkF]RSI Divergence_overlayRSI Divergence_overlay
Does not include RSI indicator.
Up Signal = Displayed green dot below the candle
Down Signal = Dispalyed red dot above the candle
* Don't trade just at the signal
RSI 다이버전스
RSI 지표 미포함.
상승 신호 = 초록색 점으로 캔들 아래 표시.
하락 신호 = 빨간색 점으로 캔들 위에 표시.
* 신호만 보고 매매하지 마세요
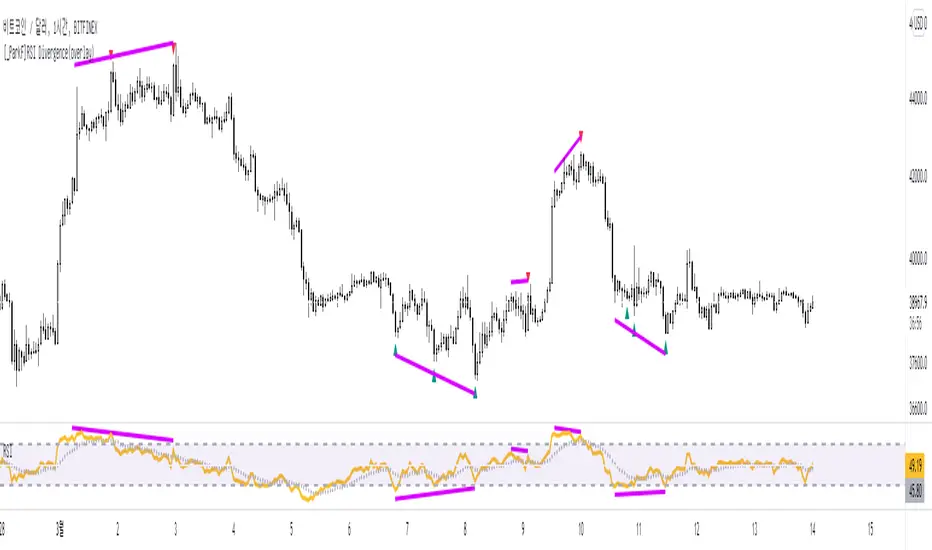
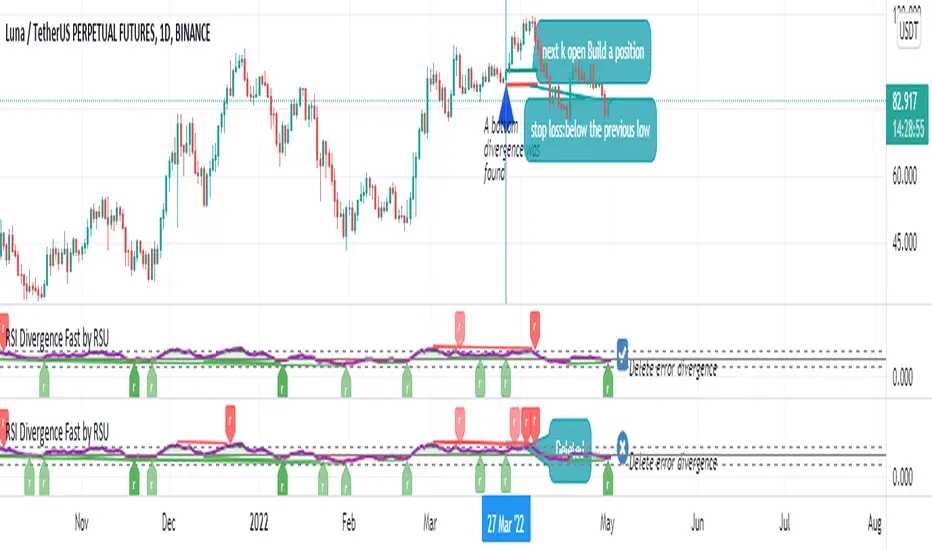
RSI Divergence Fast by RSUAdvantages:
1. When rsi is at a high point, once it falls by 1 k line, it will detect the divergence from the previous high point. This can quickly find the divergence that has taken effect and help you quickly capture the trend before a sharp decline or rise.
The difference between other RSI divergence indicators: the official divergence indicator is to detect the 5 and the k line, which may lead to a large amount of decline.
2. This indicator detects the previous high and the previous low of 5, 10, 20 lengths at the same time, instead of only detecting a fixed length, so that more deviations can be found.
Notice:
Because it is a quick divergence detection, it is recommended to confirm that the divergence takes effect after the current k is completely closed first. I have identified this state in the indicator as "k not end"
Disadvantages and Risks
Since it is a quick discovery, there will be error identification. I listed the difference between the two indicators when deleting errors. The indicator turns off the "delete error" option by default.
Please do not:
Don't go short in the uptrend, don't go long in the downtrend.
Top divergences that occur because of a strong uptrend are usually only temporary pullbacks. Bottom divergences in persistent declines are also temporary rallies. Do not attempt to trade such low-return trades.
It is recommended to use the divergence indicator when the stock price has made a new high and retraced, and once again made a new high, because this often leads to the end of the trend.
Divergence how to use:
1. After the previous K line was completely closed, a bottom divergence was found.
2. Open an long order at the beginning of the second bar, or as close to the bottom as possible (because the stop loss will be smaller).
3. Break the stop loss price below the previous low where the divergence occurred, which already means that the divergence is wrong.
RSI usage:
1. RSI is above the 50 line, in an uptrend, below 50 in a downtrend.
2. Above 70 is overbought, falling below the oversold zone may mean the end of the uptrend.
Below 30 is oversold, above the oversold zone may mean the end of the downtrend.
RSI Divergences - Candle Edition - LibertusHello all,
This is just upgrade upon my already released RSI divergences script. Divergences detection is exactly same, no difference.
I'm releasing this version because I got few requests for divergences indicator above price bars, so it doesn't take additional screen space.
New in this version is:
ability to remove pivots
ability to display smaller/shorter labels
predefined look back period for different time frames
Happy trading and good luck!
As always, I appreciate comments and likes!
If you find this useful and want to reward me:
BTC TIP JAR: 1i7nojAjxFuyFwvnZx6hbXBTLkWaUjZ8C
RSI Divergences with RSI in separate window:

RSI Divergence Strategywhat is "RSI Divergence Strategy"?
it is a RSI strategy based this indicator:
what it does?
it gives buy or sell signals according to RSI Divergences. it also has different variables such as "take profit", "stop loss" and trailing stop loss.
how it does it?
it uses the "RSI Divergence" indicator to give signal. For detailed information on how it works, you can visit the link above. The quantity of the inputs is proportional to the rsi values. Long trades are directly traded with "RSI" value, while short poses are traded with "100-RSI" value.
How to use it?
The default settings are for scalp strategy but can be used for any type of trading strategy. you can develop different strategies by changing the sections. It is quite simple to use.
RSI length is length of RSİ
source is source of RSİ
RSİ Divergence lenght is length of line on the RSI
The "take profit", "stop" and "trailing stop" parts used in the "buy" group only affect buys. The "sell" group is similarly independent of the variables in the "buy" group.
The "zoom" section is used to enlarge or reduce the indicator. it only changes the appearance, it does not affect the results of the strategy.

RSI Divergence Filtered by ZigZag RatiosRSI Divergence Filtered by ZigZag Ratios
This indicator is designed to help traders identify potential trend reversals by finding RSI divergence and then confirming it with a unique filter based on price movements. It draws two ZigZag lines on your chart to visually represent these patterns.
Core Functionality
The indicator works by doing three main things:
Price ZigZag (Blue Line): ZigZag line directly on the price chart. This line connects the significant high and low points of the price action, based on the ZigZag Deviation % you set. It's a way to simplify the trend and clearly see the "legs" or swings of the market.
RSI ZigZag (Orange Line): It also draws a separate ZigZag line, colored orange, that follows the movement of the RSI indicator. This helps you visually track the highs and lows of the RSI at the same time as the price.
Divergence Detection: The indicator continuously looks for divergence between the price ZigZag and the RSI.
The Key Filter: ZigZag Ratio
This is what makes the indicator unique. When a potential divergence is found, it doesn't just display a signal immediately. It performs an extra check:
It compares the size of the most recent price swing (the "last leg") to the size of the previous swing in the same direction. It then calculates a ratio. If the most recent swing is significantly smaller than the previous one, it confirms the signal and displays a label.
This filtering mechanism aims to weed out weak signals and highlight divergences that occur after a period of slowing momentum.
Bullish/Bearish Div Labels: When a valid, filtered divergence is found, the indicator will place a green Bullish Div label at the bottom of a low swing or a red Bearish Div label at the top of a high swing.
User Inputs
ZigZag Deviation %: This is the minimum percentage change required to form a new ZigZag pivot. The default value is set to 0.3618, which is a popular number in technical analysis. A lower value will capture more minor swings, while a higher value will focus only on larger, more significant ones.
RSI Length: The number of bars used to calculate the RSI. The default is 6, but you can adjust this to your preference.

RSI Divergence UltimateHere it is Everyone - What was once hidden is now revealed
This is the Ultimate RSI Divergence Indicator
Not only does it plot Regular and Hidden Divergence lines for an RSI smoothed by an EMA and for its Signal Line
The RSI can be set to change color with direction or can be set as single color with or with out OB / OS highlights
Color Changing RSI helps when trading Multiple Time Frames as you can look for confluence in the direction of RSI
Included options for the Signal Line include;
Various calculations EMA, SMA and Linear Regression which provides very accurate signal line crossover signals
Color Changing with direction
Second RSI with different Length
Multi Time Frame RSI
Bollinger Bands applied to the RSI
RSI Stochastic that has been compressed to fit into RSI OB / OS so that it doesnt compress the RSI when in these regions
There are also Background Highlights (thanks to Chris Moody) for when the RSI Stochastic moves into OB / OS and crosses its signal line
There are plenty of Alerts for signals with more complex alerts coming soon
I have also added Hima Reddy's Power Zones for support and resistance so now you can also
Take full advantage of trading; signal line crosses, 50 crosses and Power Zone RSI support and resistance and much more
The divergence script is thanks to @RicardoSantos, I've just adjusted it to suite my indicator
Remember that divergences work best when traded with the trend or very late in a trend when going against the trend

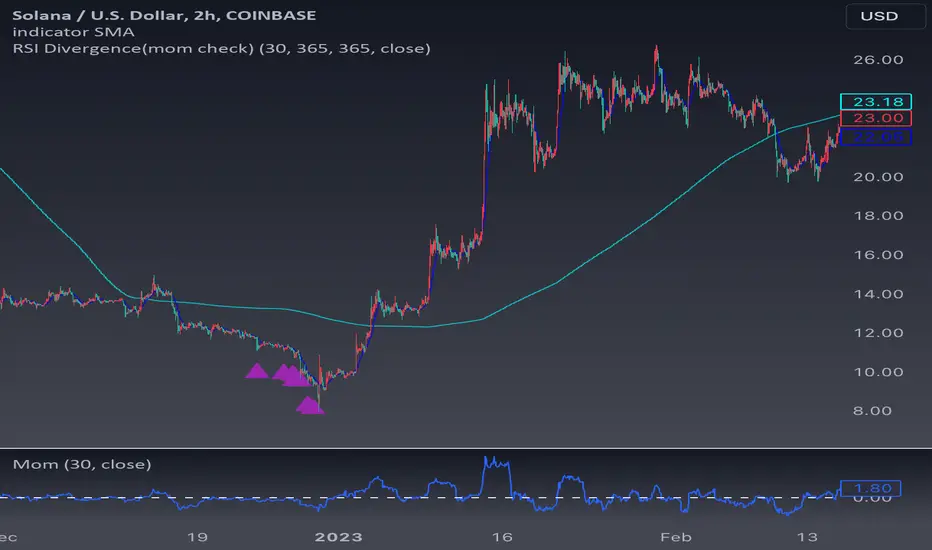
RSI divergence(mom check)The core of this indicator is obviously RSI divergence. But there are some tips I would like to explain and suggest.
First of all, although the basic principle of this indicator is simple: simply comparing the price and RSI value within a given time period. To be more specific, if the price now is lowest among last 300 candlesticks but its RSI value is not, then the candlesticks will be marked. However, sometimes it is not accurate. Here are some examples:
This is bitcoin 2h chart from COINBASE. It is true that we can capture most of corrections and make a fortune during a bull market. However, the market is not always consist of bull market:
This is also bitcoin 2h chart from COINBASE. We can imagine how much money we would lose if we buy every time solely according to the RSI divergence signals during a bear market. So, how to solve this question? As a bullish indicator, it's normal to have distortions in a bear market, but I still hope to improve its win rate and make it more reliable even though when people are trading during a bear market. So we need to add some filtering conditions to screen out all the divergence signals.
The first indicator came in my mind is: Momentum. Here is the momentum code with its zero axis:
//@version=5
indicator(title="Momentum", shorttitle="Mom", timeframe="", timeframe_gaps=true)
//input variables
len = input.int(30, minval=1, title="Length")
src = input(close, title="Source")
//calculate momentum
mom = src - src
//draw momentum chart
plot(mom, color=#2962FF, title="MOM")
//draw 0 axis
hline(0, "Zero Line", color=color.white)
One thing we should notice is that ’30’ is the time period of the momentum, you can change this to everything you want according to which assets you are trading. For example, in a long-run bullish stock market or gold market, you can set ’60’. But when it comes to futures or crypto, maybe 30 is a better choice.
Now, I use momentum as a condition to distinguish a bearish trend: if the all momentum value of past 100 candlesticks of my RSI divergence signals are minus, which means these divergence signals are in a bearish trend, in this case, I market them as purple signal2. Attached are some examples of BTC, ETH and SOL charts. We can see if we trade according to green signal1s. We gonna have to cut our losses multiple times, and for leveraged traders, it could even mean facing liquidation. However, signal2 has helped filter most of signal1s. So in most conditions, I believe the appearance of signal2 represents the end of bearish trends.
So far, we have created an overall frame. And I have set ‘alertcondition’ functions so that we can use this indicator to set alerts.
Here are some tips I would like to suggest based on my personal experiences:
1. Set stop losses and follow them strictly;
2. Adjust the time period according to different assets. For instance, 4h chart is good for bitcoin and most altcoin. But when it comes to stock market, 12h or 1d may be a better choice. You need to find the best suitable time period by yourself;
3. In a bear market, please be especially cautious with the green Signal 1; they are great for following uptrends but are not suitable for bottom-fishing. I recommend waiting for the purple Signal 2 to appear before placing trust again in the green Signal 1.
4. To be continued….
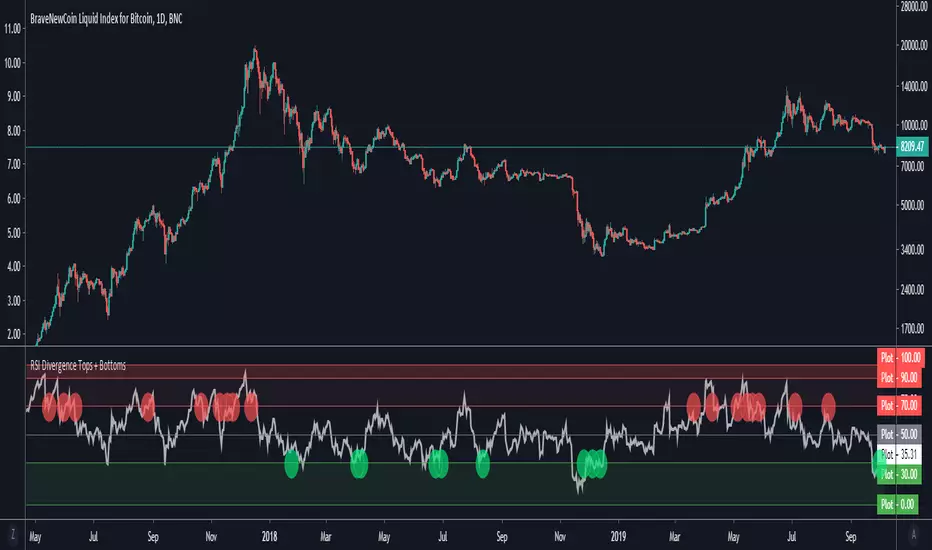
RSI Divergence Tops + BottomsRSI Indicator which plots local peaks and troughs in divergence.
Divergence is specified as:
- A higher price, with reduced RSI --> Potential Sell Point
- A lower price, with higher RSI --> Potential Buy Point
RSI Divergence should be used in combination with other indicators. This indicator identifies local tops and bottoms, with potential for macro trend shifts.
Read more about trading RSI Divergence on Investopedia here: www.investopedia.com

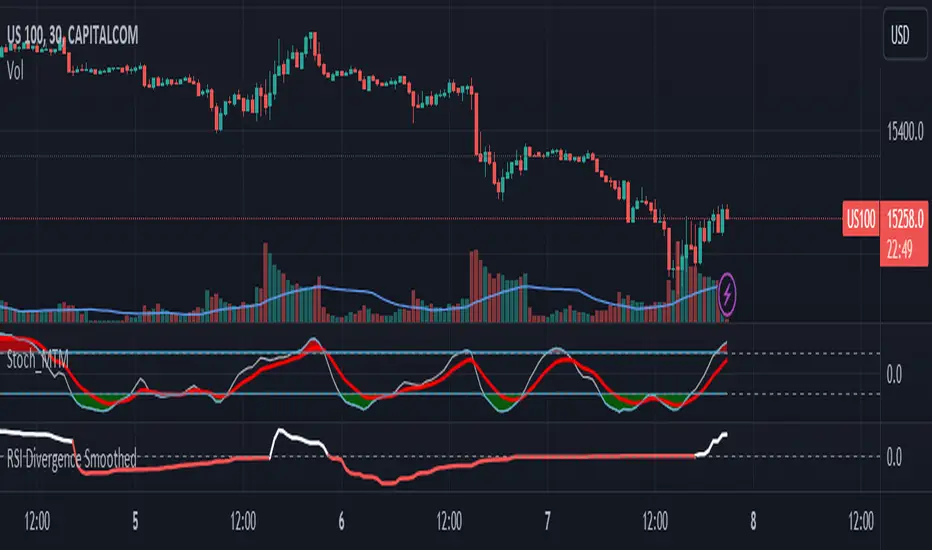
RSI Divergence SmoothedRSI Divergence Smoothed
This indicator is based on the RSI Divergence indicator by @InvestitoreComune.
The "RSI Divergence Smoothed" is a custom technical indicator designed to highlight divergence between two RSI (Relative Strength Index) lines: a fast RSI and a slow RSI. The divergence is then visualized on the chart, assisting traders in recognizing potential market reversals and trend continuation.
Here's a breakdown of its smoothing options added:
1. **WMA Difference**: The indicator first computes a weighted moving average (WMA) difference, which takes the difference between the WMA of half the input length and the WMA of the full length.
2. **Hull Moving Average (HMA)**: The indicator can use the HMA as a filter. HMA combines the benefits of a simple moving average and a linear weighted moving average, aiming to be faster in response to price changes.
3. **Sine Weighted Moving Average (SWMA)**: Another filter option, SWMA, weighs the data points by the sine of their position in the data set, giving more weight to the central data points.
4. **Kaufman's Adaptive Moving Average (KAMA)**: KAMA adapts to price volatility and can also be used as a filter. It's especially useful in choppy markets, adjusting the smoothing constant based on the relative volatility of the price series.
5. **Gaussian Moving Average (GMA)**: This filter uses a Gaussian kernel to weigh the data points, emphasizing the more recent data while giving lesser importance to older data. It helps smooth out the price data, potentially eliminating some of the noise.
I've personally found the KAMA smoothing to be most helpful but keen to hear of anyone's personal experiences and recommendations.
RSI divergence computations are based on the filtered price (or raw price if no filter is chosen) - the indicator calculates two RSIs:
- Fast RSI: With a default length of 5 periods.
- Slow RSI: With a default length of 14 periods.
The core functionality of this indicator is to compute the divergence between the Fast and Slow RSI. The divergence is plotted on the chart, with the color indicating its direction: white for positive divergence and red for negative.
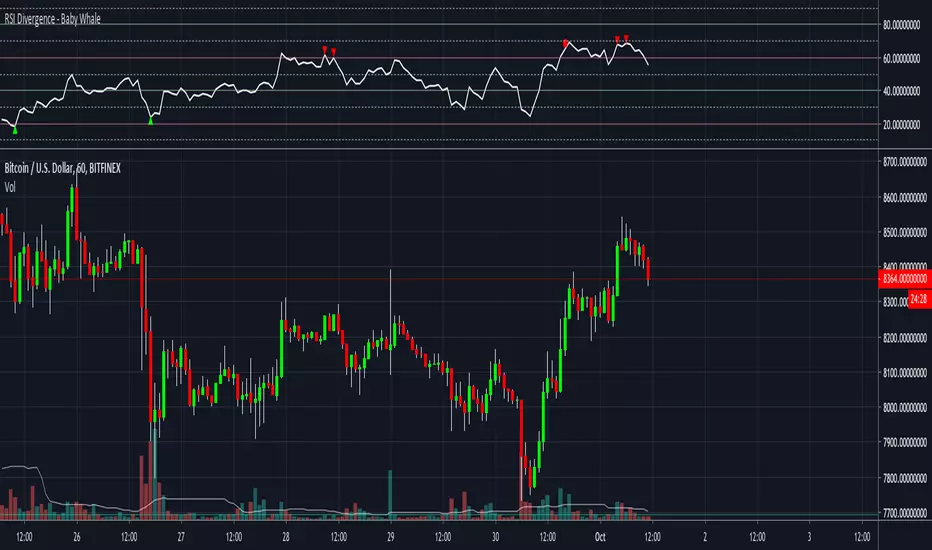
RSI Divergence - Baby WhaleHey guys!
BabyWhale here!
I will open source my scripts, so everyone can use them and update.
In this RSI Divergence script I added Hidden Divergence (beta) as well.
This script will show you:
Bullish Divergence (green triangle)
Hidden Bullish Divergence (green circle)
Bearish Divergence (red triangle)
Hidden Bearish Divergence (red circle)
You can set the RSI values.
I recommend 60 / 40 or 70 / 30.
Last but not least, you can set alarms when a Divergence or Hidden Divergence is found.
Feedback is always welcome!
Credits to @Libertus, I used his script as inspiration.
Good luck with trading!
BabyWhale
RSI Divergence PRO - Baby WhaleThis RSI script will show you the following things:
When the RSI moves between the green lines (40 - 80++) we are in a Bull market.
If the RSI moves between the middle green and red line (40-60) we have some sideways action.
And yes, when the RSI is between the red lines (60 - 20--) we can say that we are in a Bear market.
The dashed lines in between are on every 10 points on the RSI .
All colors and lines are customisable.
The real MVP -1.38% of this scrip is the RSI Divergence spotter.
A little green or red triangle will show up on the chart when a RSI Divergence is formed.
The Divergence is only shown when it happens in overbought (70+) or oversold (30-) regions to avoid too many signals.
I highly recommend not to jump in on every signal you get, but also use multiple reasons, like Elliot Wave or fib levels, before entering a trade.
This Pro version is for paid subscribers of TradingView only.
It will give you the ability to create alert inside of TradingView.
If you want access, just send a message please.
Much love from Baby Whale!!
🙏❤️🐳

RSI Divergence - Baby WhaleThis RSI script will show you the following things:
When the RSI moves between the green lines (40 - 80++) we are in a Bull market.
If the RSI moves between the middle green and red line (40-60) we have some sideways action.
And yes, when the RSI is between the red lines (60 - 20--) we can say that we are in a Bear market.
The dashed lines in between are on every 10 points on the RSI.
All colors and lines are customisable.
The real MVP of this scrip is the RSI Divergence spotter.
A little green or red triangle will show up on the chart when a RSI Divergence is formed.
The Divergence is only shown when it happens in overbought (70+) or oversold (30-) regions to avoid too many signals.
I highly recommend not to jump in on every signal you get, but also use multiple reasons, like Elliot Wave or fib levels, before entering a trade.
If you want access, just send a message please.
Much love from Baby Whale!!
🙏❤️🐳

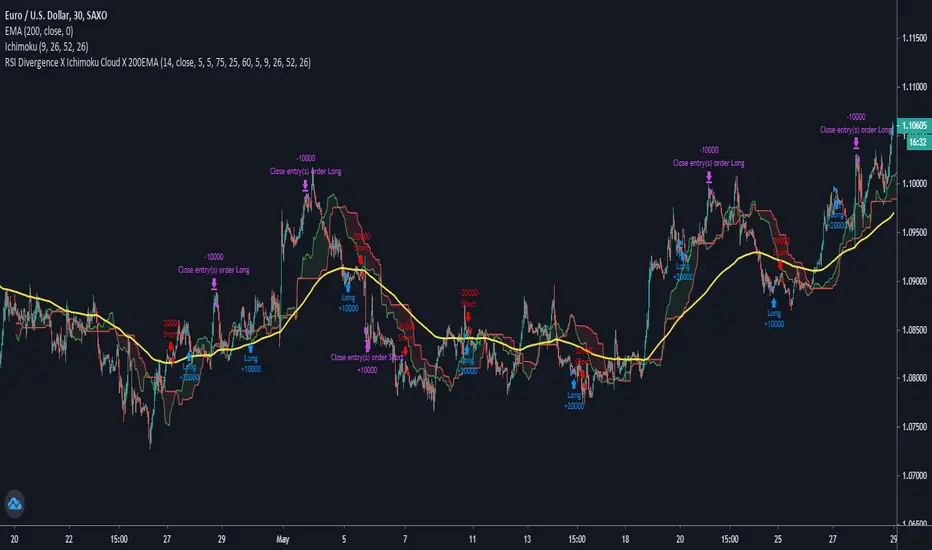
RSI Divergence X Ichimoku Cloud X 200EMAHi all,
This script is a combination of the RSI Divergence Strategy combined with Ichimoku Cloud and 200 EMA .
A long position is entered only when the RSI identifies a bullish divergence (either regular or hidden), and that the Ichimoku Cloud is above the 200 EMA . This is to ensure that there is a confirmation of a bullish trend before an entry.
Similarly, a short position is entered only when the RSI identified a bearish divergence (either regular or hidden), and that the Ichimoku Cloud is below the 200 EMA . This is to ensure that there is a confirmation of a bearish trend before an entry.
I find that this script works best on Intraday charts.
This is just a simple script I built on my third attempt of backtesting strategies on TradingView. Do give it a go and let me know if you guys have any feedback or comments about it. Happy trading!
RSI Divergence AlertRSI Divergence Alert
Input: range
Bullish RSI Divergence
yellow
Bearish RSI Divergence
red

RSI DivergenceThe RSI DIvergence script tries to predict the upper and lower trend-lines for the current security’s RSI.
The script identifies peaks and valleys within the RSI and then tries to draw a trend-line in between the peaks and the valleys. The longest possible trend-line originating from the latest peak/valley will be used to determine whether or not the trend is moving up or down, the slope of the trend-line will then dictate the direction of the trend.
(If no trend line can be drawn from the latest peak/valley, the current value of the RSI will be used as the origin point of the trend-line)
Once the script has identified the trendlines they will be superimposed on the RSI line as dashed lines. The color of the dashed lines will depend on the direction of the trend, an upwards moving trend will be depicted in green,whilst a downwards moving trend will be depicted in red.
Furthermore, the script will draw two arrows, representing the short term trend and the long term trend, as to make it even more clear which direction the two trend-lines have.
If only one trend-line (either upper or lower) can be found, the script will replace the corresponding arrow with a diamond shape instead.